Long post so here is a Table of context to keep it readable.
- Festive Tech calendar 2020 – Thanks!
- UPPDATE to the service!
- Monitoring
- QUICK GUIDE to enable proactive monitoring!
- Proactive Monitoring – Smart Detect
- Applications Insights smart detection
- Failure anomalies
- Failure anomalies Alert flow
- Troubleshooting tip
- Smart detect (Performance anomalies)
- Smart detect (Performance anomalies) Alert flow
- Workspace based Application insights vs legacy plain Application insights
- ARM template configuration
- App insights
- Failure Anomalies
- Smart Detect
- Conclusion
- Christmas present! – GitHub templates
Festive Tech calendar 2020 – Thanks!
This blog is written as a contribution to the Festive Tech Calendar 2020, It is really great initiative from @gregor_suttie and @Pixel_Robots (Richard Hooper), a rerun from last year.
I wrote about it and some other initiatives for Christmas calendars here.

Thank you for having me in this years calendar!
While reading this blog post you could listen to some “classical” Swedish Christmas songs: Playlist!

Also do not miss the Christmas present at the end of the blog.
UPPDATE to the service!
Since this post was published some preview features making it easier to manage has been released. Alerts based smart detection for application insights. And see also the detailed Migrate Azure Monitor Application Insights smart detection to alerts
Monitoring
Monitoring is essential for operations, it is not a minor thing to get in place nor a minor thing to keep purposed and accurate.
You most certainly have a monitoring solution in place for your IT environment today, it works well and is robust, you always get notified when something is broken… would it not be nice to be notified before it is broken?
Monitoring in classical sense is a reactive action, you get notified when something stops responding or working.
The cloud solutions for monitoring are different, hard to compare directly against the tools currently running.
Azure Monitor is the single pane of glass for the monitoring, or it is working towards it.
You still need to tweak and configure things like Log Analytics, be aware of the Insights for some of the services and some other services does not natively work out of the box, like Kubernetes and Data Bricks.
It is not a small task to get the full picture and manage it.
Designing a monitoring strategy or solution for your hybrid IT environment or cloud requires a lot of effort, will probably do a deeper post on that sometime but this is a starting point.
QUICK GUIDE to enable proactive monitoring!
The “Smart Detection” alerts and the “Application Insights Smart Detection” action group are default configured to Email the subscription’s monitoring contributors and monitoring readers.
Assign those roles to the persons that needs to receive proactive monitoring alerts by mail and you pretty much have secured proactive monitoring for the whole subscription 😉
If you would like to dig into details on why, how and get a sense of the alert flow + a heads up on some flaws with too much abbreviation in the setup, then I have tried to write about it in this post.
Proactive monitoring
In this post I will focus on Proactive Monitoring using Application insights Smart Detection, more specifically Failure anomalies and Performance anomalies.
This is something you most likely do not get with any other existing tools, they are enabled by Microsoft developed ML models for finding anomalies and trends that is flagged for you to take action on.
So not an error but a difference in the behavior of your code that you can proactively react on to improve before it becomes a real error/outage.
Failure anomalies Alert logic details
The alerts are triggered by our proprietary machine learning algorithm so we cannot share the exact implementation details. With that said, we understand that you sometimes need to know more about how the underlying logic works. The primary factors that are evaluated to determine if an alert should be triggered are:
- Analysis of the failure percentage of requests/dependencies in a rolling time window of 20 minutes.
- A comparison of the failure percentage of the last 20 minutes to the rate in the last 40 minutes and the past seven days and looking for significant deviations that exceed X-times that standard deviation.
- Using an adaptive limit for the minimum failure percentage, which varies based on the app’s volume of requests/dependencies.
- There is logic that can automatically resolve the fired alert monitor condition if the issue is no longer detected for 8-24 hours. Note: in the current design. a notification or action will not be sent when a Smart Detection alert is resolved. You can check if a Smart Detection alert was resolved in the Azure portal.
Performance anomalies detection
Application Insights has detected that the performance of your application has degraded in one of these ways:
- Response time degradation – Your app has started responding to requests more slowly than it used to. The change might have been rapid, for example because there was a regression in your latest deployment. Or it might have been gradual, maybe caused by a memory leak.
- Dependency duration degradation – Your app makes calls to a REST API, database, or other dependency. The dependency is responding more slowly than it used to.
- Slow performance pattern – Your app appears to have a performance issue that is affecting only some requests. For example, pages are loading more slowly on one type of browser than others; or requests are being served more slowly from one server. Currently, our algorithms look at page load times, request response times, and dependency response times.
Smart Detection requires at least 8 days of telemetry at a workable volume to establish a baseline of normal performance. So, after your application has been running for that period, any significant issue will result in a notification.
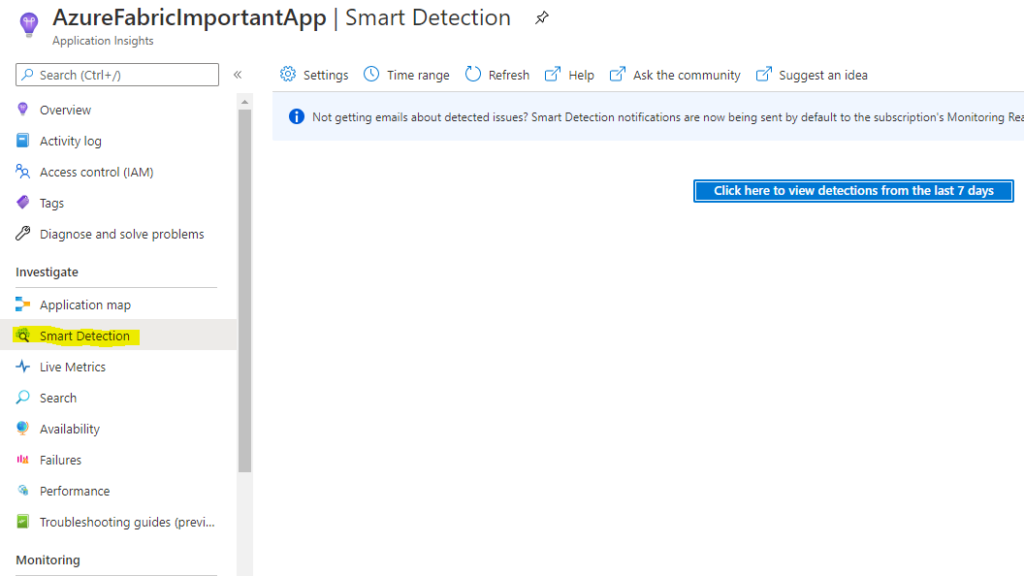
Applications Insights smart detection
This Smart Detection feature is automatically enabled when creating an application insights instance.
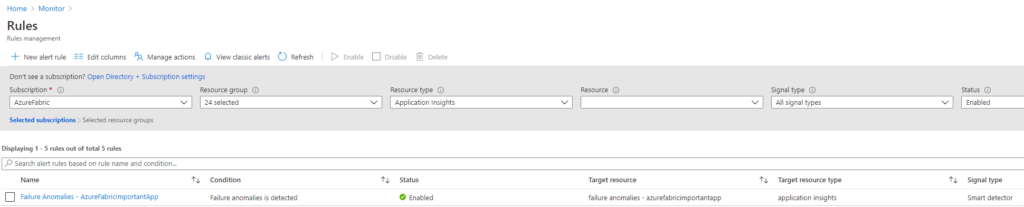
Failure Anomalies
“Note” This also creates an Alert rule “Failure Anomalies – your app insights name” but also an action group named “Application Insights Smart Detection”
The first application insights instance you create in the subscription decides the Resource group location for this Action Group.
Alert rule
Action group
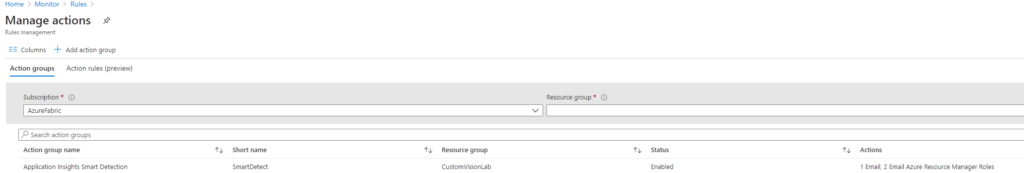
The Action group will then be used by all following “Failure Anomalies” alerts.
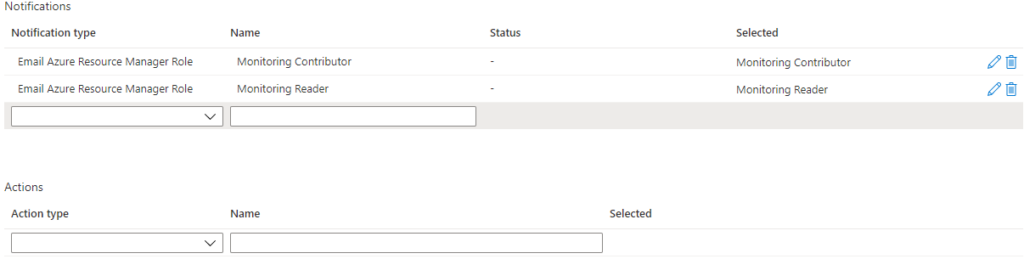
Default the Action group sends mail to Monitoring Contributor or Monitoring Reader.
It has no actions defined default.
All Application insights will create the “Failure – Anomalies” Alert rules and use the same action group “Application Insights Smart Detection” that was created when the first application insights instance was created.
In many cases I would just like a mail sent to a DL or an action/webhook/flow that creates a ticket in my ITSM tool, it would be easy to add that to this Action group. then automatically you have all “Failure – Anomalies ” alerts connected to this action group.
Since every instance of application insights that is created will create an alert for “Failure – Anomalies” and connected to the same action group, I could just modify this in the action group with adding an E-Mail and I would have automatic proactive monitoring setup for my subscription.
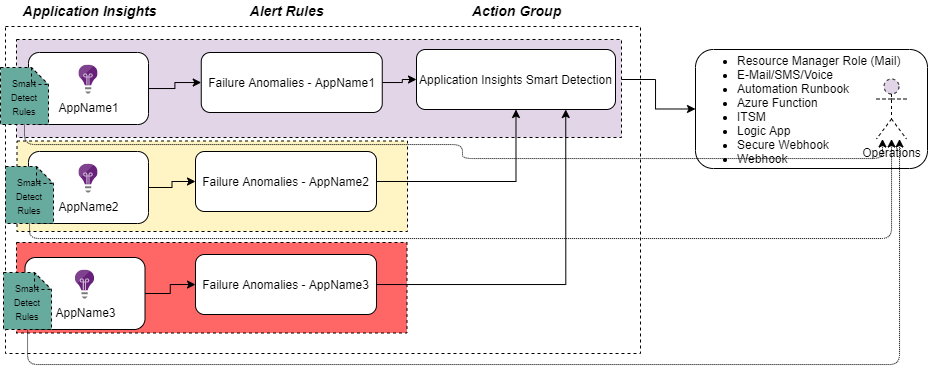
Failure Anomalies alert flow
Here I try to illustrate the relation of the alerting, the first application insights I create in the subscription (Purple resource group) also creates the Actions Group.
All following application insights instances alert rules will then leverage that action group automatically.
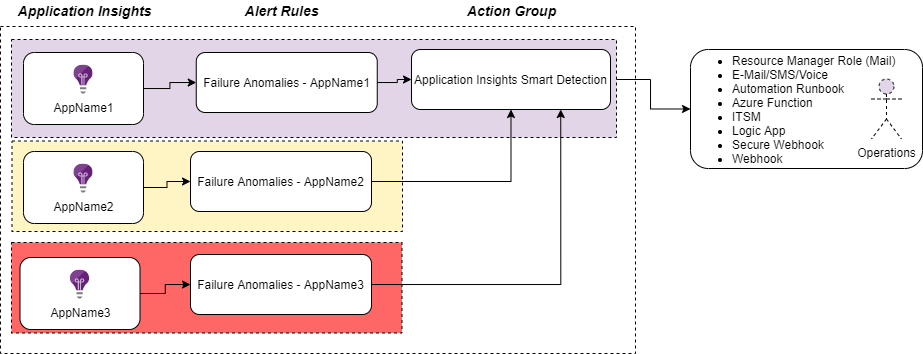
So, you have “proactive monitoring” enabled from start just by having the application insights deployed, pretty sweet!
But here we need to be aware of that if we delete the first resource group, we also delete the action group, doing this we kill the notifications from all the other Failure Anomalies alerts.
It is simple just to change the Actions for the Alert Rules to another action group, but since the whole setup is abbreviated from you this might need some verification.
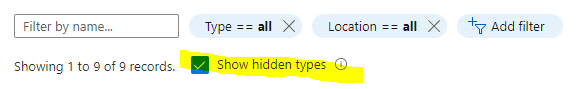
“Note – the Action group is a hidden resource in your resource groups”
Troubleshooting tip
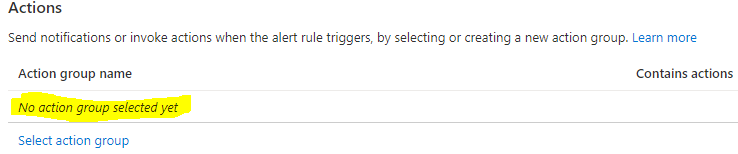
If you find and “Failure Anomalies – AppName” alert rule without an Action group when it should have had one.
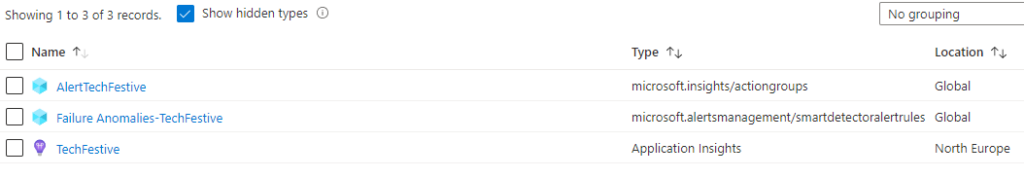
One way to check the relation is to look go to the Resource Explorer, go to the resource group of your application, find the resources [microsoft.alertsmanagement/smartDetectorAlertRules] and look at the “groupIds” in the definition.
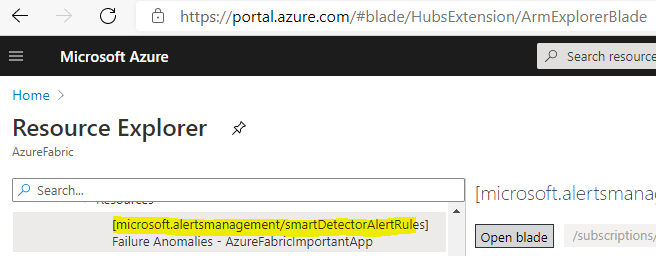
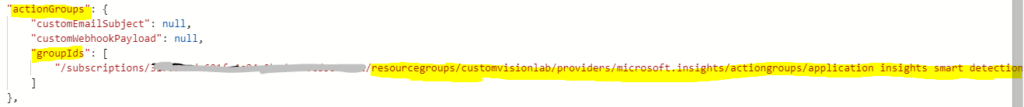
Most likely it is pointing to a resource group and action group that has been deleted and effectively your notifications are not sent.
Smart Detect (performance anomalies)
Next thing in the Smart Detection feature is checking the “Smart Detection Rules”
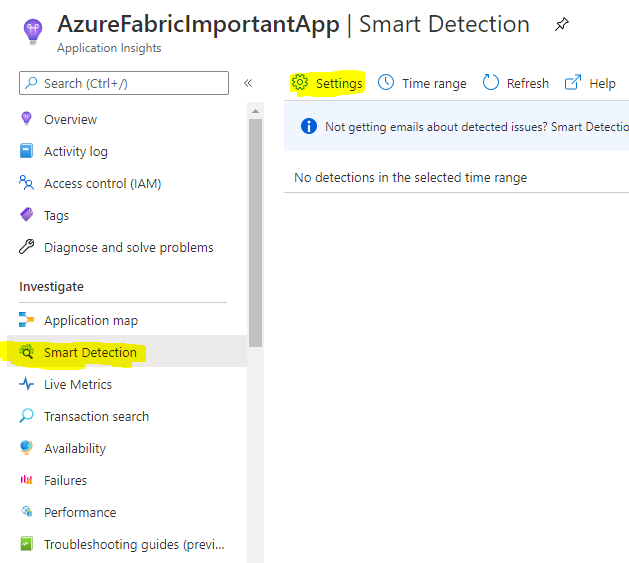
If an alert is fired it will show un in this page and you get full insights and can drill down to the details and get routed to all the insights in application insights.
But with many application insights deployed you would miss this since you would not look here regularly.
The smart detection rules are these.
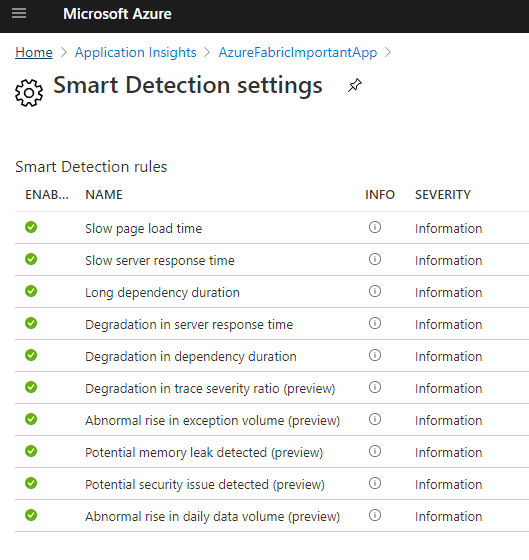
Each rule can/needs to be configured with email destination, unless you do not follow the quick guide at top of this blog post and just assign the roles for “monitoring contributor” and “monitoring reader” and they will receive the mail.
The alert rules with (preview) does not support email notifications so there we need to go with the resource roles if we want the notification.
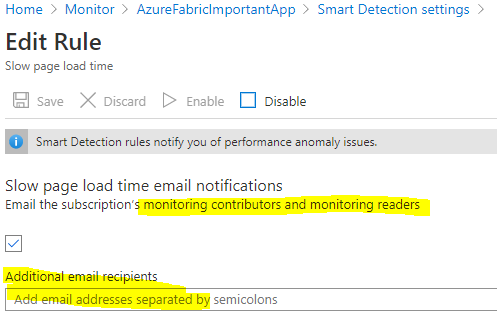
Smart detect (Performance anomalies) Alert flow
The smart detect rules are directly configured for each rule in each application insights instances.
Workspace based Application insights and Legacy plain Application insights?
Usually Application insights is enabled by the developers building applications, eventually you have multiple application insights instances with configurations sprawl.
At some time, you might need to dig into the Applications insights settings and configurations, especially on the sampling since this also effects what is reported and it is a cost factor.
Also be aware of the new feature Workspace based Application insights and what the, now called, classic Application Insights is.
The difference is that instead of having the Application insights logs remaining “withing the instance” they can now be consolidated from all instances in the same Log analytics workspace.
Keeping the infrastructure and plaform less disbursed.
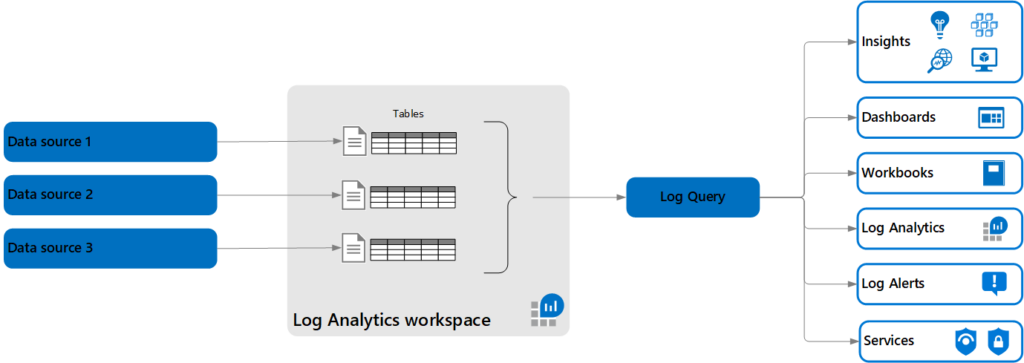
We are going from this.
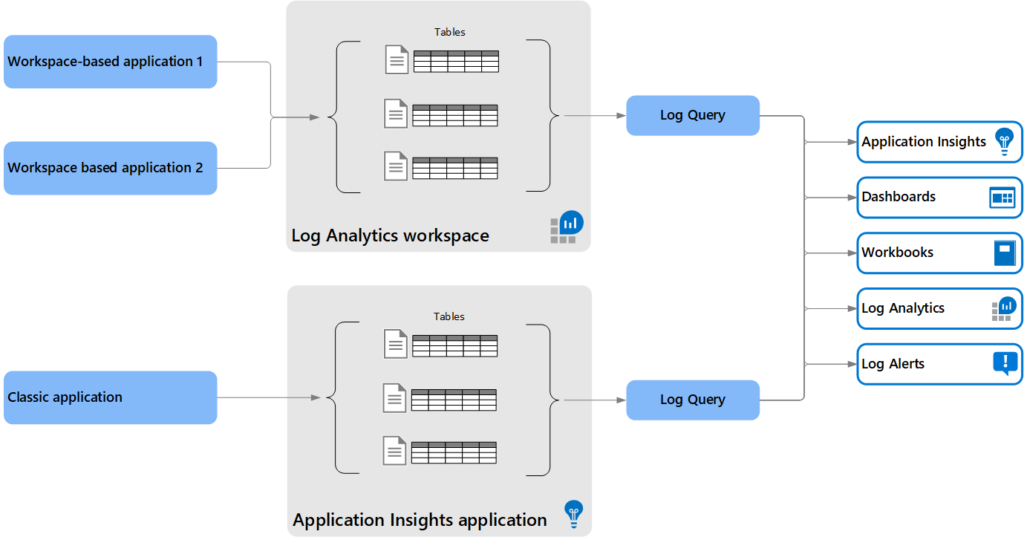
To this
If you want to migrate your existing “classical” Application insights to the new Workspace based then here is a guide for that.
This is something to take note on since today the developers would continue setting up the instances as they are used to, meaning classic.
But to be fair, if they should switch over to Workspace based, they would need to know the Log Analytics workspace they should use.
Here the monitoring design come into play again, something you should have upfront if enforcing the Workspace based deployments, design would cover multiple subscriptions, RBAC on the workspaces etc.
See this guide for inspiration.
ARM template configuration-ARMing the proactiveness
Safe to say is you eventually need do all above things with a DevOps culture, meaning you do IaC (infra as code).
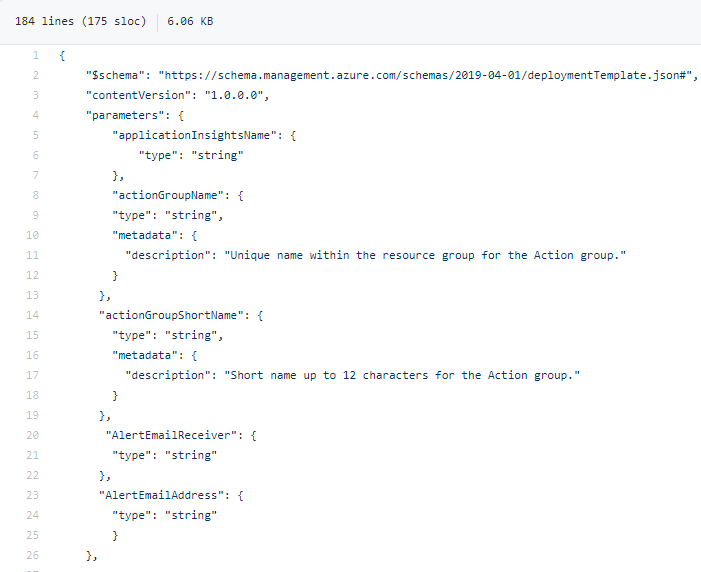
That means ARM templates!
Main reference to keep when doing ARM Templates is The Resource Manager template reference documentation, and in this case the insights resource types.
Application insights Smart detect references.
I have combined all of these and here is a template that does the following.
- Creates the application insights instance with Type “general” (This I have tried to understand deeper but failing to find the docs for it, if you know please reach out on twitter :))
- Adds an email to all smart detect rules (not the preview) and ensures they are enabled
- Creates an Action group with “Monitoring Reader”, “Monitoring Contributor” and email receivers enabled.
- Created the “Failure Anomalies” alert and connects it to the action group
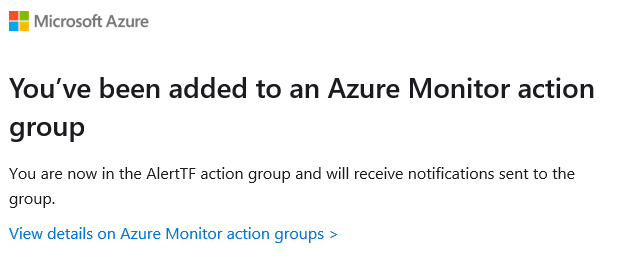
Once deployed
And you will get notified you are in the Action Group.
Conclusion
- ARMing your Proactive monitoring could be a bit tricky but most likely something that you would need to do eventually
- Get on top of the Workspace based deployments
- Check if you can leverage the roles for your email notifications instead of setting email on each alert rule and action group for the proactive monitoring.
Christmas presents!
Since this is festive tech calendar I need to hand out some gifts 🙂

1: GitHub including template + PowerShell Snippet and Draw.io drawing and PNGs of the flows